
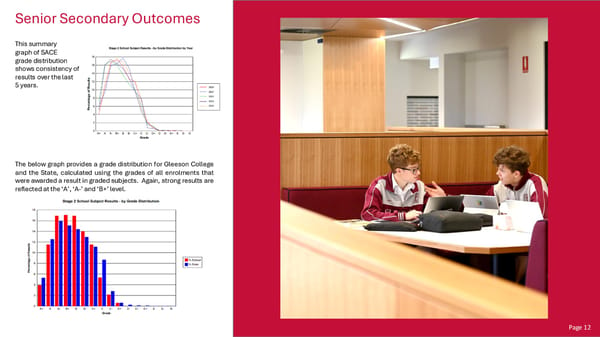
Senior Secondary Outcomes This summary graph of SACE grade distribution shows consistency of results over the last 5 years. The below graph provides a grade distribution for Gleeson College and the State, calculated using the grades of all enrolments that were awarded a result in graded subjects. Again, strong results are reflected at the ‘A’, ‘A-’ and ‘B+’ level. Page 12
 Gleeson College School Performance Report – 2024 Page 13 Page 15